
“What gets measured gets managed”
Peter Drucker
I’ve always believed that when customer issues pile up and satisfaction drops, it’s clear something’s off.
But without the right customer support KPIs, can you really find the root cause? Food for thought!
Slow response times, unresolved tickets, and unhappy customers can quietly hurt your business. That’s why tracking the right metrics is more important than ever.
In this guide, I’ll break down 21 must-know customer support KPIs to help you identify bottlenecks, boost your team’s efficiency, and keep your customers coming back.
Let’s turn support challenges into golden opportunities!
What are Customer Support KPIs?
(Here’s a short video on how robust reporting & tracking enhance customer support)
Customer Support KPIs are measurable indicators that help businesses evaluate the performance of their customer support teams. These Key Performance Indicators track important aspects such as response time, resolution rate, customer satisfaction, and average handling time.
They help businesses understand how quickly and effectively support teams resolve issues, ensuring customers are happy with the service. By monitoring these KPIs, companies can spot trends, identify improvement opportunities, and make informed decisions.
Ultimately, KPIs for customer support teams are crucial tools that keep teams accountable and ensure customers receive reliable, timely assistance, fostering long-lasting trust and customer loyalty. They provide valuable insights for continuous improvement.
Why are Customer Support KPIs Important?
Numbers don’t lie, and in customer support, they tell a powerful story. Understanding those numbers is key. Let me show you why customer service KPIs are essential:
1. Performance Clarity
Customer Support KPIs serve as a critical mirror reflecting the operational health of support teams. By tracking key metrics, organizations identify performance gaps and pinpoint areas for improvement. These measurements allow managers to objectively assess team performance while highlighting where additional training or resources are needed.
Monitoring KPIs enables proactive adjustments before small issues escalate, ensuring consistent service quality and enhancing overall team effectiveness. The clarity gained from these metrics builds a strong foundation for continuous development and customer experiences.
2. Driving Accountability
Customer Support KPIs drive accountability and empower teams to embrace a culture of transparency and improvement. By setting measurable goals, support representatives understand their roles and the impact of their efforts on performance.
When metrics are well-defined, every team member is motivated to achieve targets and collaborate to overcome challenges. This shared responsibility encourages innovative problem-solving, rewards excellence, and builds trust among colleagues.
Ultimately, accountability through KPIs creates a truly supportive environment that elevates customer satisfaction and sustainable business success.
3. Operational Efficiency
Customer Support KPIs streamline operations and drive efficiency by offering clear, actionable insights into everyday workflows. They reveal bottlenecks and highlight process improvements
that optimize service delivery. With timely data, managers adjust team assignments, reallocate resources, and implement strategies to resolve issues faster.
This systematic approach reduces response times, minimizes errors, and enhances overall productivity. As a result, support teams can adapt quickly to changing demands, ensuring every customer interaction remains remarkably efficient, effective, and aligned with the organization’s standards.
4. Boost Customer Satisfaction
Customer Support KPIs enhance customer satisfaction by ensuring support is timely, effective, and personalized. They provide teams with vital data to assess service quality and make immediate improvements. By monitoring metrics such as response times, resolution rates, and customer feedback, teams can quickly address issues and refine their methods.
This ongoing feedback loop promotes smoother communication, faster resolutions, and consistently positive interactions. Consequently, improved satisfaction boosts customer loyalty and propels long-term business growth. Overall, these KPIs consistently yield outstanding results.
5. Strategic Decision-Making
Customer Support KPIs enable data-driven decision-making and strategic improvements by providing clear insights into team performance and customer behavior. They empower leaders to recognize support trends, forecast demand, and allocate resources effectively.
With these insights, organizations can streamline their support infrastructure and adapt to shifting customer needs. Informed strategies allow companies to set achievable goals, benchmark against industry standards, and invest in training initiatives.
Ultimately, using KPIs not only boosts service quality but also drives business innovation and sustainable success.
The Ultimate List of Top 21 Customer Support KPIs
Effective customer support relies on tracking key performance indicators that provide clear insights into service quality and efficiency. Below are 21 essential customer support KPI examples to help you monitor performance and continuously improve your customer support.
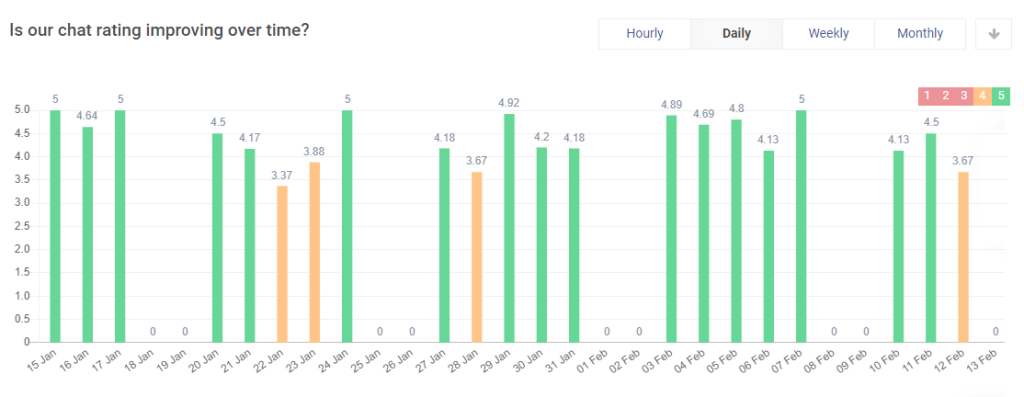
1. Customer Satisfaction (CSAT) Score
Customer Satisfaction (CSAT) Score measures how content customers are with their support experience. It typically involves asking customers to rate their interactions on a scale, providing a straightforward snapshot of service quality. A high CSAT indicates that issues are resolved effectively and customers feel valued, while a lower score suggests areas needing improvement.
Regularly tracking CSAT can highlight trends over time, guide training efforts, and refine service protocols. This simple yet powerful metric offers clear insights into customer perceptions, helping teams adjust strategies to ensure every interaction contributes positively to overall satisfaction and long-term loyalty.
2. Net Promoter Score (NPS)
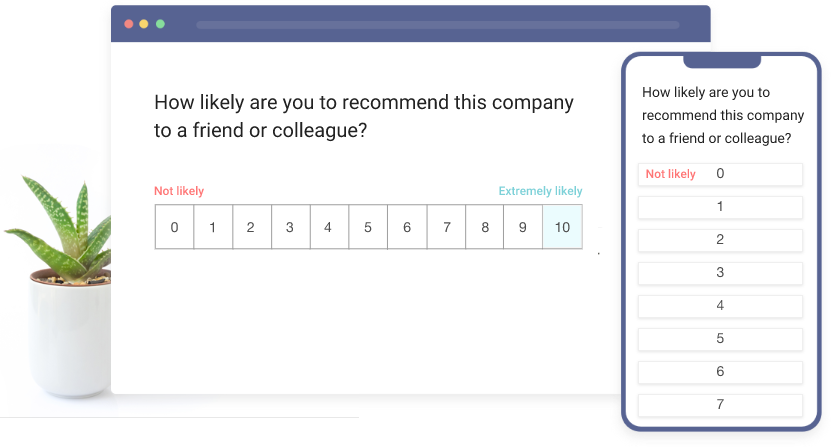
Net Promoter Score (NPS) gauges customer loyalty by asking a single, straightforward question about the likelihood of recommending a service. It categorizes customers into promoters, passives, and detractors based on their ratings.
A high NPS indicates strong customer advocacy and satisfaction, while a low score can reveal potential issues needing attention. Regular monitoring of NPS helps teams understand overall sentiment and identify trends.
This metric offers valuable insights into brand reputation and future growth opportunities. By addressing concerns highlighted through NPS feedback, businesses can enhance customer experiences and foster lasting relationships.
Protip: I recommend checking out this video on how to calculate Net Promoter Score to master the process in no time!
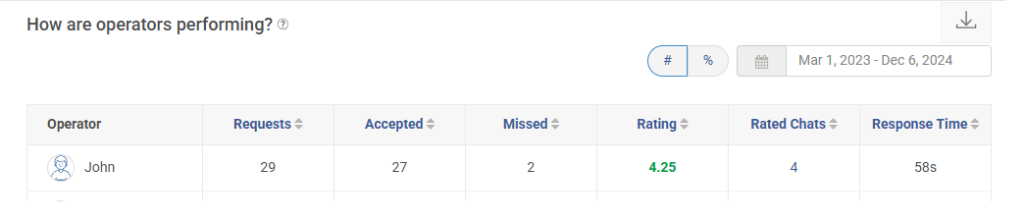
3. Operator Performance Report
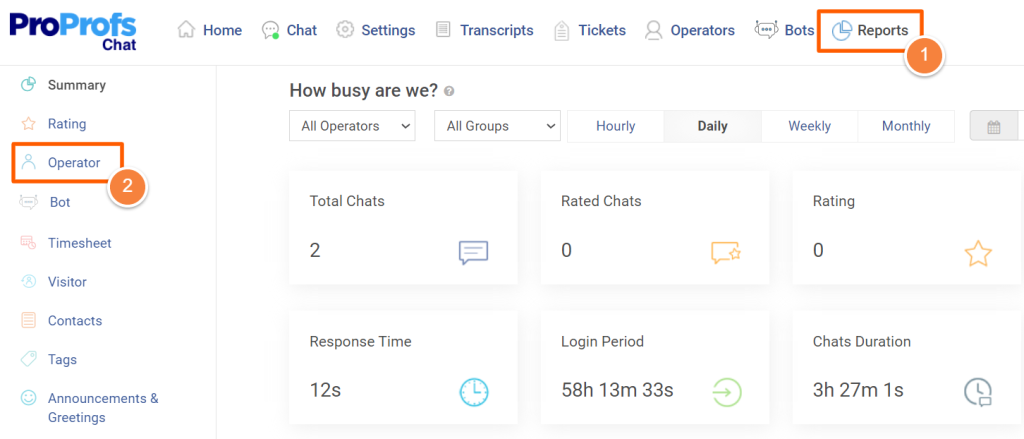
Keeping track of how well your support team is doing is essential for offering great service. One important metric to look at is the operator performance report. It helps you understand how well each agent is handling customer questions and whether they’re meeting the standards you’ve set.
For live chat, this becomes even more useful. It helps you track things like response times, missed chats, rated chats, etc. This gives you a clear idea of how each agent is performing.
Looking at the operator performance report lets you see which agents are doing a great job and which ones might need a bit more training.
4. First Response Time (FRT)
First Response Time (FRT) measures the interval between when a customer submits a query and when they receive the initial response from support. A shorter FRT reassures customers that their issues are being addressed promptly.
Responses can set a positive tone for the entire support interaction and build trust. Monitoring FRT helps teams identify delays and optimize workflows to ensure timely communication.
This metric is crucial for improving customer satisfaction and managing expectations effectively. By reducing FRT, organizations can demonstrate commitment to service excellence, ensuring every customer feels valued and heard from the first contact.
5. Average Resolution Time (ART)
Average Resolution Time (ART) calculates the mean duration required to resolve customer issues from the time a ticket is opened until it is closed. This metric provides insight into the efficiency of support operations and the effectiveness of troubleshooting processes.
A shorter ART reflects prompt problem-solving and can lead to higher customer satisfaction, while a longer ART may indicate underlying challenges.
Monitoring ART helps teams identify bottlenecks and implement strategies for faster resolutions. By analyzing this KPI, organizations can optimize workflows, allocate resources more effectively, and continuously improve service delivery.
6. First Contact Resolution (FCR) Rate
First Contact Resolution (FCR) Rate measures the percentage of customer issues resolved during the initial interaction with support. A high FCR indicates effective problem-solving and efficient use of resources, reducing the need for follow-up contacts.
It reflects the team’s ability to address concerns quickly and accurately. Monitoring FCR can help identify areas where additional training or process improvements are necessary.
This metric not only enhances customer satisfaction by minimizing repeated contacts but also boosts operational efficiency. By striving for a higher FCR, organizations can create a more seamless and satisfying support experience that builds long-term customer loyalty.
7. Ticket Volume
Ticket Volume represents the total number of support requests received within a specific period. This metric provides insight into overall demand and can indicate trends in customer issues.
A surge in ticket volume might signal seasonal fluctuations, emerging problems, or increased customer engagement. By monitoring this KPI, organizations can better allocate resources, adjust staffing levels, and identify common issues that need attention.
Analyzing ticket volume also helps in evaluating the effectiveness of self-service options and automated responses. Ultimately, understanding ticket volume is essential for planning, forecasting, and continuously improving the support process to ensure customers receive timely and efficient assistance.
8. Backlog of Unresolved Tickets
The backlog of Unresolved Tickets tracks the number of customer support issues that remain open beyond the expected resolution time. A growing backlog can indicate inefficiencies, resource constraints, or complex problems.
This metric is essential for identifying areas where the support process may be lagging.
Regular analysis of this KPI enables organizations to refine processes, implement better ticket management strategies, and ultimately maintain a high standard of service by keeping the support queue under control.
9. Customer Retention Rate
Customer Retention Rate measures the percentage of customers who continue to do business with an organization over a specific period. A high retention rate indicates strong customer loyalty and satisfaction, reflecting effective support and product quality. It serves as a key indicator of success and customer trust.
By monitoring retention, companies can identify strategies as well as areas needing improvement. This metric helps in developing targeted initiatives to enhance engagement and reduce churn.
Focusing on customer retention leads to sustainable growth, increased revenue, and a positive brand reputation, all of which contribute to a thriving business environment and customer relationships.
10. Churn Rate
Churn Rate calculates the percentage of customers who discontinue their relationship with a company over a given period. A high churn rate may indicate dissatisfaction, unresolved issues, or stronger competition. Monitoring this metric allows organizations to identify underlying problems in customer service or product quality.
By understanding customer churn, businesses can implement targeted strategies to improve customer retention and overall satisfaction. Reducing churn is crucial for maintaining a stable revenue stream and long-term growth.
This KPI provides valuable insights into customer behavior and helps guide improvements in support processes, ultimately fostering stronger loyalty and a more resilient customer base for success.
11. Cost Per Resolution
Cost Per Resolution measures the average expense incurred by a support team to resolve a customer issue. It includes costs related to staffing, technology, and other resources used during the resolution process.
A lower cost per resolution suggests efficient operations, while a higher cost may indicate process inefficiencies or complex issues requiring additional resources.
Monitoring cost per resolution helps balance financial performance with customer satisfaction, ultimately supporting a sustainable, consistently optimized support model that drives overall remarkable business success.
12. Agent Utilization Rate
Agent Utilization Rate measures the percentage of time support agents spend actively engaged in handling customer inquiries. This metric provides insight into workforce efficiency and helps in balancing workloads to avoid overburdening staff.
Monitoring this KPI enables managers to adjust schedules, reallocate tasks, and ensure that agents maintain quality interactions without being overwhelmed. By optimizing agent utilization, organizations can improve service response times, enhance customer satisfaction, and foster a healthy work environment.
13. Agent Turnover Rate
Agent Turnover Rate calculates the percentage of support agents who leave an organization over a specific period. High turnover can be disruptive and costly, leading to recruitment and training expenses. It may also signal underlying issues related to job satisfaction, work environment, or management practices.
By tracking this KPI, companies can identify trends, address employee concerns, and implement strategies to improve retention. A stable turnover rate is indicative of a positive workplace culture and strong leadership.
14. Call Abandonment Rate
Call Abandonment Rate measures the percentage of incoming calls that are disconnected by customers before reaching a support agent. This metric is a key indicator of customer frustration and can highlight issues with wait times or call routing inefficiencies.
A high abandonment rate may suggest that customers are experiencing long delays or inadequate service, prompting them to hang up. By monitoring this KPI, organizations can identify staffing gaps or process shortcomings and take corrective actions.
Lowering the call abandonment rate improves overall customer experience, ensuring that callers receive timely assistance and feel truly valued throughout their interaction with support services.
15. Self-Service Success Rate
Self-Service Success Rate tracks the percentage of customer issues resolved through automated or self-help channels without direct agent involvement. This metric highlights the effectiveness of FAQs, knowledge bases, and chatbots in empowering customers to find solutions on their own. A high success rate indicates that customers are efficiently resolving common problems, reducing the demand on live support and lowering operational costs.
Boosting self-service success not only boosts customer satisfaction by providing answers but also frees up agents to handle more complex inquiries, contributing to overall support efficiency.
16. Escalation Rate
Escalation Rate measures the percentage of customer issues that are transferred to higher-level support or specialized teams. A high escalation rate may indicate that initial support levels are not adequately resolving problems, suggesting a need for additional training or resources.
This KPI helps identify gaps in frontline resolution capabilities and highlights areas where processes can be improved.
By monitoring escalations, organizations can streamline issue resolution and enhance overall service quality. Lowering the escalation rate can lead to quicker resolutions, reduced operational costs, and improved customer satisfaction.
17. Resolution SLA Compliance Rate
Resolution SLA Compliance Rate tracks the percentage of support cases resolved within the agreed-upon Service Level Agreement timeframes. This metric is critical for assessing how well a support team meets its promised response and resolution times.
A high compliance rate reflects operational efficiency and a strong commitment to customer service, while a low rate may indicate process delays or resource limitations.
Monitoring this KPI enables organizations to identify and address bottlenecks, improve workflow processes, and ensure that customer expectations are consistently met.
18. Customer Complaints
Customer Complaints track the number of negative feedback instances or formal grievances submitted by customers regarding support interactions. This KPI provides direct insight into areas where service may be falling short of expectations.
Here is an example of a customer complaining about McDonald’s service.
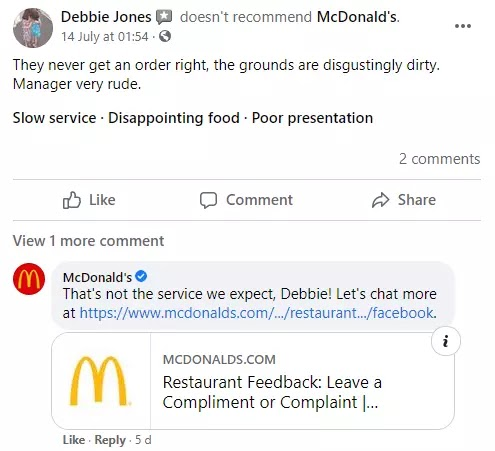
Image Source: Statusbrew
A higher volume of complaints can signal recurring issues, communication breakdowns, or unresolved problems that require immediate attention.
By monitoring customer complaints, organizations can identify trends, address systemic challenges, and implement corrective measures. Effectively managing complaints not only improves service quality but also strengthens customer relationships and trust.
19. Support Channel Performance
Support Channel Performance evaluates how effectively each communication channel—such as phone, email, chat, and social media—serves customer needs. This KPI provides insights into response times, resolution rates, and customer satisfaction across different platforms.
By comparing performance metrics across channels, organizations can identify strengths, pinpoint areas for improvement, and allocate resources more strategically.
Optimizing each support channel ensures a consistent and efficient customer experience, regardless of the method of contact.
20. Refund Request Rate
Refund Request Rate measures the frequency at which customers request refunds for products or services. This KPI can highlight potential dissatisfaction, product quality issues, or misaligned expectations. A high refund request rate may signal underlying problems that need urgent attention, while a low rate typically indicates smoother customer experiences.
By monitoring refund requests, organizations can identify trends, assess the impact of service changes, and adjust policies to better meet customer needs.
21. Social Media Sentiment Analysis
Social Media Sentiment Analysis gauges public perception by examining customer comments, reviews, and interactions on various social platforms. This KPI provides real-time insights into how a brand and its support services are perceived by the public.
Positive sentiment can enhance brand reputation and foster customer loyalty, while negative sentiment may highlight areas that need immediate improvement.
By monitoring social media trends and feedback, organizations can quickly respond to issues, adjust strategies, and improve overall customer engagement.
Key Challenges in Achieving Customer Service KPI Metrics
Customer service is the heartbeat of any business, and reaching those KPI targets can sometimes feel like untangling a complex web. Here are some common challenges teams face when trying to achieve these metrics.
1. Aligning KPIs with Business Objectives
It all starts with making sure that your KPIs are not just numbers on a dashboard but truly reflect your company’s core goals. When your metrics are closely tied to the strategic objectives of your organization, every data point can guide meaningful decisions. However, achieving this alignment often requires a deep understanding of both operational details and high-level business strategies.
Misalignment can lead to teams working in silos or focusing on the wrong activities, which ultimately hampers overall growth. Integrating feedback from multiple departments and regularly revisiting your KPIs ensures that they evolve in step with your business’s vision.
2. Ensuring Data Quality and Consistency
Reliable insights come from reliable data, but gathering accurate, consistent information isn’t always easy. Data quality issues such as outdated entries, inconsistent formats, or incomplete information can distort your understanding of customer interactions.
This challenge is compounded when data sources vary widely—from CRM systems to social media analytics—and each tool may have its own standards.
Investing time in regular audits, cleaning your data, and setting up unified data entry protocols can significantly enhance the trustworthiness of your metrics and lead to better decision-making.
3. Integrating Technology and Systems
In today’s digital landscape, customer service data often lives across a spectrum of platforms—from chatbots and email systems to advanced CRM software. Integrating these technologies is crucial for painting a complete picture of your performance.
However, incompatibilities, legacy systems, and fragmented tools can create data silos that leave you with a patchwork of insights rather than a cohesive view.
Overcoming this challenge usually means investing in technology that can bridge these gaps or rethinking your tech stack to prioritize interoperability and scalability, ensuring that every interaction is captured and analyzed seamlessly.
4. Employee Buy-In and Training
No matter how well-designed your KPIs are, they’re only effective if your team understands and embraces them. Employees may feel overwhelmed or skeptical about new metrics, particularly if they’re seen as additional scrutiny rather than tools for improvement. Detailed, ongoing training sessions and transparent communication about how each KPI ties into the larger business goals can help demystify the process.
When team members see the direct connection between their work and the business’s success, they’re more likely to actively participate in tracking and enhancing these metrics, making the entire system more robust.
5. Adapting to Evolving Customer Expectations
Customer expectations are not static—they evolve with technology, cultural shifts, and market trends. What worked as a benchmark last year might not resonate with customers today. This dynamic environment forces you to regularly review and adjust your KPIs to stay relevant.
It requires a proactive approach to monitor trends, gather direct customer feedback, and incorporate this new intelligence into your performance metrics. Without this adaptability, even the most meticulously chosen KPIs can become outdated, leaving you ill-equipped to meet modern customer demands.
FREE. All Features. FOREVER!
Try our Forever FREE account with all premium features!
Master Your Support Strategy With Actionable KPIs
These 21 Key Performance Indicators provide a clear roadmap for achieving outstanding customer support by guiding your strategies and performance improvements. They empower you to identify critical areas, optimize processes, and enhance customer satisfaction.
To make the most of these KPIs, regularly analyze performance, set clear goals, and ensure your team is aligned with customer needs.
For a seamless approach to measuring and upgrading your support performance, try ProProfs Chat. It simplifies tracking, empowers your team, and ensures you consistently deliver the exceptional customer experience your brand deserves!
FREE. All Features. FOREVER!
Try our Forever FREE account with all premium features!
 We'd love your feedback!
What did you like & how can we make it even better?

 Thanks for your feedback!
 Ask Your Question
Have a question? Get expert help to make your decision easier.